Is Residential Housing Still a Smart Investment?

My post here is going to have some controversy, the Boomers and X Generation will read this and argue against direct residential property investments, while the Millennials and Z Generations will see this as hope on how to build wealth outside of property. Firstly, let me start by saying that your principal home should not be considered an investment you need to live somewhere and the emotional security of having your home can’t be priced. I have focused this post on residential housing as an investment choice among many investment choices available. More recently I am getting enquiries from clients on buying residential investment properties off the back of the perceived next housing boom as we enter a MILD financial easing regime. Yes, let me say this right upfront inflation is sticky globally and interest rates globally have and will ease but STOP THINKING we can go back to sub 3% mortgage rates. This was a once in a generation event.
For generations, Australians have treated residential property as the default path to wealth. Parents urged their children to get onto the ladder early, investors reached for debt to ‘make the property work’, and policy settings often nudged households toward ownership. After three decades of extraordinary gains, that belief feels earned. But beliefs forged in one regime can mislead in another. As we move deeper into the 2020s, it’s fair to ask: does housing still deserve top billing in a modern portfolio—or has the investment case shifted enough that property may not be the golden goose for long term wealth accumulation.
The great Australian boom—what the data actually shows
Start with the scoreboard. Over the past twenty years, Australian house prices rose about 154% and unit prices about 106%. Every capital outpaced inflation. That long, compounding run lifted our market into the global top tier for price levels and pushed affordability to historic extremes—Sydney’s median house price now sits around fourteen times the median household income, with Melbourne and Adelaide also ranking among the least affordable cities internationally. Those are not abstract numbers; they shape life decisions for a generation of would‑be buyers.
Why prices exploded: demand pulled forward, supply held back
Three forces did the heavy lifting. First, population growth—driven primarily by net overseas migration—kept demand structurally high. In the year to March 2025, Australia added roughly 450000 people, and nearly three‑quarters of that increase came from migration. Second, pandemic‑era fiscal programmes such as JobKeeper and HomeBuilder injected cash and confidence into households just as the Reserve Bank cut rates to historic lows. Cheaper credit and stronger balance sheets translated directly into bidding power. Third, construction costs surged. Materials, logistics, and labour shortages pushed the average cost of building a new detached house to around half a million dollars by 2025, making new supply harder and slower to deliver. When demand is pulled forward and supply is constrained, prices do one thing: they run.
The affordability shock: who gets left behind
Affordability is the bridge between macro data and everyday life. With median house prices north of A$1.1 million in key markets, the deposit hurdle alone can exceed A$220,000. Add stamp duty and transaction costs and many first‑home buyers are staring at an entry ticket closer to A$270,000. Meanwhile, the Real Estate Institute of Australia estimates that average loan repayments now absorb roughly 47.7% of median family income—near cyclical peaks. It’s little wonder Millennials and Gen Z feel locked out. Without intergenerational help, saving the deposit while paying market rents is a marathon that too often gets longer each year.
The next thirty years won’t look like the last thirty
Markets are path‑dependent. The demographic and policy winds that filled the sails of the last cycle are changing. The Centre for Population projects the national growth rate slowing toward 1.2% by the mid‑2030s, while the age profile tilts older. A larger share of the population will be drawing down assets, downsizing, or staying put—behaviours that reduce churn and soften incremental demand. Layer in the persistence of higher real interest rates than we grew used to in the 2010s, and the simple extrapolation of past capital gains becomes a weak planning tool.
What investors should care about: total return after costs and tax
Housing delivers two return streams: income (rent) and capital appreciation. But property’s sticker returns often overstate the investor’s true outcome because of fractional costs (stamp duty, legal fees, agent’s fees etc), then add ongoing expenses (maintenance, insurance, rates, strata), and tax. Once those are netted off—and especially after financing costs—many portfolios rely on capital gains to do the heavy lifting. That worked brilliantly during the boom. It is less compelling if nominal growth moderates and yields remain modest.
A fair comparison: housing vs diversified liquid assets
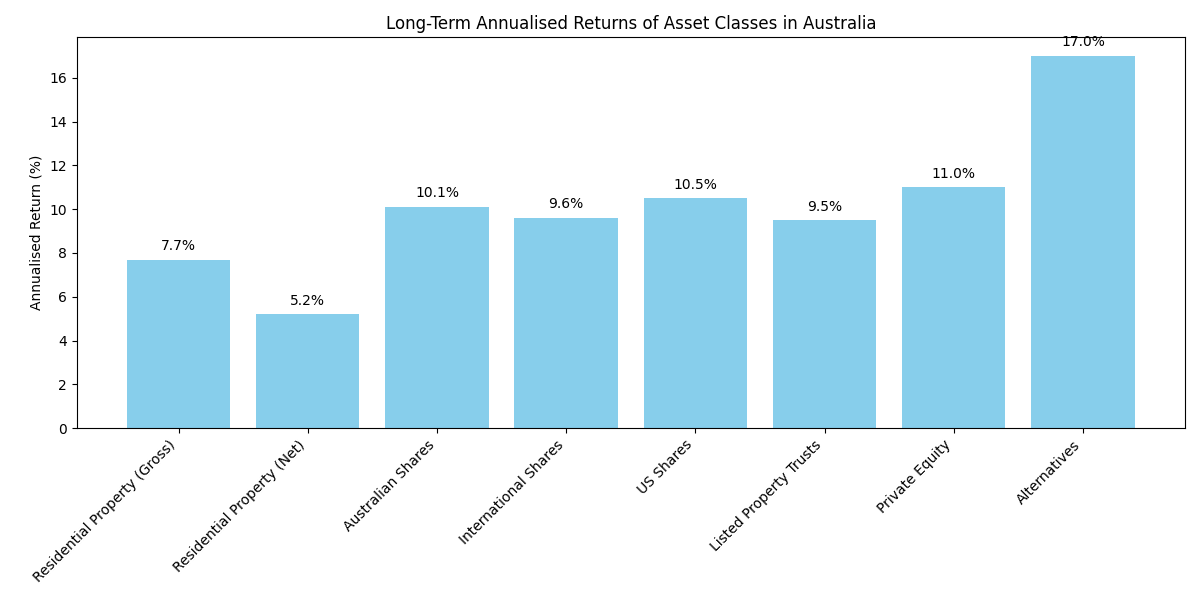
Over the past two decades, Australian residential property has delivered solid capital growth of 7.7% annually, but when accounting for holding costs, the net return drops to 5.2%. In contrast, diversified investments like shares, listed property, and private equity have historically returned 10–11% per annum, with alternatives even higher—though early crypto inflates that figure. Over three decades, Australian shares averaged 10.1%, international shares 9.6%, and listed property trusts in the high 9s. While property is often chosen for its leverage potential (up to 80%), its concentrated risk, illiquidity, and lower net returns mean it typically underperforms diversified portfolios that offer broader exposure across sectors, geographies, and asset classes.
What could the next 5–10 years look like?
Forecasting is hazardous, but scenario thinking is essential. A conservative base case recognises slower population growth, higher real borrowing costs than last decade, and stretched affordability. In that world, nominal dwelling prices grow slowly and unevenly, with pockets of outperformance where land is genuinely scarce or where policy unlocks density near jobs and transport. An upside case requires migration staying elevated while supply remains constrained—possible in the short run, but difficult to bank on indefinitely given political and planning pressures. A downside case features higher‑for‑longer rates or a deteriorating employment market, where nominal growth stalls and real returns rely on rental income. The common thread across scenarios is not that property fails, but that it becomes more selective—alpha is earned by buying better, operating better, or adding value, rather than by simply owning anything and waiting.
Where housing still shines
In my opinion I can only make one argument for buying residential housing and that is, if it is your principal home or an investment property you plan to move in too.
The liquidity dividend—and why it’s undervalued
Liquidity is not just about convenience; it is about risk control and compounding. In liquid markets, you can systematically rebalance—harvesting gains from winners and adding to laggards—without incurring outsized costs. You can dollar‑cost average through volatility, deploy cash flows as they arrive, and implement tax‑aware strategies with precision. Illiquid assets like property can still play a role, but they impose timing risk: you may be forced to sell at the wrong moment, or unable to sell when you should. Frictions also discourage portfolio changes, which can trap investors in sub‑optimal allocations for years. The last cycle rewarded illiquidity; the next may reward agility.
A practical framework for decision‑making
If you’re weighing property against alternatives today, approach it like an investment committee would. Start with objectives: are you seeking income, growth, or housing security? Map constraints: deposit capacity, borrowing power, career stability, and time horizon. Build a total‑return model that explicitly includes stamp duty, maintenance, rental vacancy assumptions, land tax, selling costs, and the opportunity cost of equity tied up in the deposit. Stress‑test with higher interest rates and lower capital growth than history. Compare that to a diversified portfolio using realistic fee assumptions and dividend reinvestment. If property still clears the hurdle for you, pursue it—but be selective about asset and location, and have a plan for maintenance and cash buffers. If it doesn’t, don’t force it because of cultural inertia. Money is agnostic; it compounds wherever maths and behaviour allow it to.
So, is housing still a smart investment?
Not really, Sure for some objectives, in some places, with the right structure. But as a default wealth strategy for the average investor, the case is weaker than it once was. The last twenty years rewarded leverage on a rising tide. The next decade is more likely to reward diversification, liquidity, and discipline.
Post Script Imricor – Its not If But When

I remain highly confident in my overweight, concentrated position in Imricor. Over the past few weeks or so, I’ve received many calls and messages asking, “What’s happening with Imricor?” The reality is, we’ve been spoiled over the last 12–18 months with a steady stream of news that kept the stock on everyone’s radar. That flow has slowed for now, but as I said in my last post: It’s not if, but when. The timing may be slower than we’d like, but the train is still moving forward.
Here’s what’s happened in the past two months:
- Regulatory progress: The company submitted its second FDA application and received European approval (CE Mark) for its new MRI-compatible catheter, mapping system, and EP platform.
- Clinical milestone: The first MRI-guided heart procedure was done in Amsterdam, kicking off a new clinical trial (VISABL-VT), with more hospitals joining soon.
- Commercial expansion: Imricor grew its hospital pipeline from 7 to 26 sites, opened a European office, and advanced two MRI labs in Saudi Arabia
- Financially, 1H FY25 revenue was modest at USD $196k due to trial participation, but the company holds a strong cash position of USD $50.3M, positioning it well for growth as regulatory approvals progress.
Sources and References
Australian Property Institute (20‑year growth tables); ABS (Population; CPI trimmed mean); Finder (global price comparison); Domain analysis of ABS construction costs; REIA (Housing Affordability); Vanguard Index Chart; Treasury (HomeBuilder); ATO (JobKeeper); CoreLogic/Cotality (Home Value Index 2020–2025); Centre for Population (projections to 2035).
Disclaimer
This information is of a general nature only and has been provided without taking account of your objectives, financial situation or needs. Because of this, you should consider whether the information is appropriate in light of your particular objectives, financial situation, and needs.
Authorised Representative (AR) Disclosures:
Disclosures should include the following:
- Licensee Name and AFSL Number
- Licensee ABN
- Corporate Authorised Representative (CAR)
- Name and Number (if applicable)
- Authorised Representative (AR) Name and Number (if applicable)
- Contact details, including business email and phone number.