The Coming Blow-Off Top and Inevitable Sell-Off Cycle

Happy New Year, and Welcome to 2026!
It seems somewhat foolish to think you can predict where markets are heading, but with 37 years in financial markets under my belt, I’ve witnessed a lot and experienced first-hand trading various markets—from bonds to currencies to equities, often with leverage via derivatives. A trader must forecast the likely path ahead to make any money; you certainly can’t trade off the latest data report. Instead, you’re sizing up the next year’s trajectory, and your trade size is how you manage risk—and indeed, your returns.
If I’m honest, I may be completely wrong here, or I may be right—but either way, this isn’t a win-or-lose binary. For me, it’s all about managing risk. So, my brave call for 2026: Expect a blow-off top from here, where the S&P 500 might rally another 7-10%… and then we get a selloff—either violent or gradual, but sustained.
The S&P 500’s Hot Streak: History’s
Take The S&P 500 just delivered its third straight year of strong double-digit gains: +26% in 2023, +25% in 2024, and +18% in 2025. For those wondering where the ASX 200 ended 2025? About +7%, with a 3-year total of ~15% compared to the S&P’s whopping 69%. (We’ll save the shrinking Australian market and the need to invest offshore for another day.)
After a run like this, the big question is: Can we expect a fourth—or even fifth year of 10%+ returns? Is it rainbows and lollipops again? History offers some perspective. I’ve looked at instances where the market posted three consecutive years of 15%+ gains. This rare setup has occurred only three times in modern history:
- 1949–1952
- 1995–1998
- 2023–2025 (the one we’re in now)
In those prior cases, the fourth year delivered >10% gains about 60% of the time—slightly better than a coin flip. Not terrible odds, but hardly a guarantee. That said, probabilities based on past patterns don’t tell the full story. We also need to ask: How expensive are stocks today compared to those earlier periods?
Valuations: The CAPE Ratio Reality Check
My preferred tool for this is the Shiller CAPE Ratio (Cyclically Adjusted Price-to-Earnings), developed by Nobel laureate Robert Shiller. Unlike the standard P/E—which can swing wildly with one year’s earnings—the CAPE divides the S&P 500’s price by its average inflation-adjusted earnings over the past 10 years. This slow-moving metric filters out short-term noise for a clearer long-term view. Key historical benchmarks:
- CAPE below 15 → Often signals undervaluation and strong forward returns
- CAPE above 30 → Flashes caution; extreme levels have preceded major corrections
Now compare the starting valuations for those rare four-year streaks:
- End of 1952: CAPE ~12.3 (deeply undervalued)
- End of 1998: CAPE ~32.6 (already expensive—followed by the dot-com bust)
- End of 2025: CAPE ~40 (among the highest ever, second only to the 1999–2000 peak)
Blow-Off Tops: When Euphoria Meets Reality
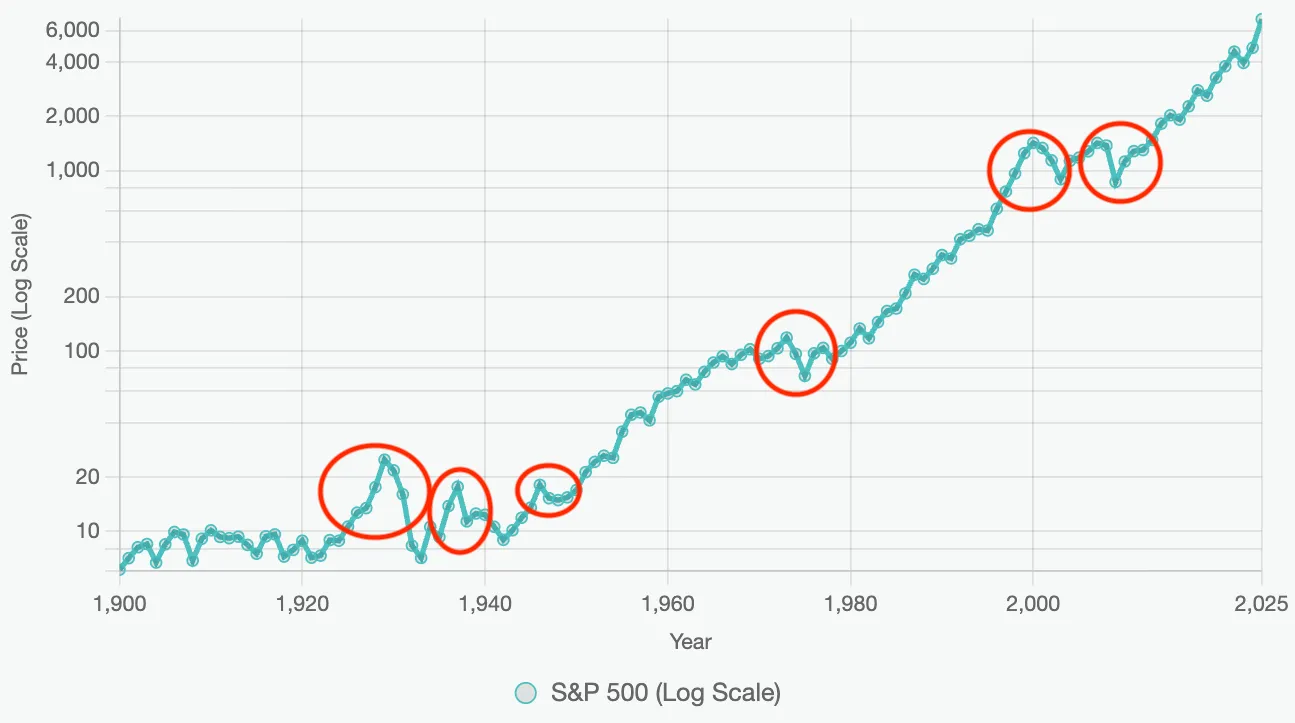
Building on these extreme valuations, it’s worth examining historical episodes of rapid price acceleration leading to blow-off tops—those euphoric, parabolic surges where markets detach from fundamentals before a violent reversal. These patterns have appeared infrequently but with devastating consequences, often amid speculative bubbles.
For instance, in the Roaring Twenties, the S&P 500 experienced explosive growth fueled by margin debt and unchecked optimism, culminating in a September 1929 peak followed by an 86% plunge to the June 1932 trough during the Great Depression. Similarly, after the initial Depression recovery, stocks accelerated sharply from 1935 onward, hitting a March 1937 high before dropping 55% by March 1938 amid renewed economic contraction.
The most recent classic blow-off was the dot-com era, where tech-driven mania propelled the index to a March 2000 summit after years of outsized gains, only to erase 49% by the October 2002 bottom as the bubble burst. While not all major declines stem from pure blow-off tops, other severe sell-offs like the 1973-1974 oil crisis (48% drop) and the 2008 financial meltdown (57% fall) highlight how overextended markets can amplify downturns when catalysts hit.
Buffett’s Dry Powder and Dalio’s Bubble Warning
If that’s not enough to raise eyebrows, look at what the investing legends are doing and saying right now—it’s like a flashing caution light in this euphoric market. Berkshire Hathaway’s cash pile has ballooned to a record ~$382 billion, mostly sitting in short-term U.S. Treasury bills, the highest ever—a clear sign that Warren Buffett sees most equities as richly priced and is happily holding massive “dry powder” rather than forcing trades. As he puts it, he’s “only swinging at pitches we like,” preserving discipline and optionality while others chase the rally. And Ray Dalio isn’t mincing words either: he says we’re “definitely in a bubble,” with his proprietary Bubble Indicator pegging conditions at roughly 80% of the extremes seen in 1929 and 2000, driven by sky-high valuations, leverage, and widening wealth gaps. Dalio’s big message? Protection through true diversification is essential before the risks materialise.
AI: The Next Dot-Com? A History Lesson
So, I’ve laid out some historic price action and valuation analysis, but we also need to look at the specific fundamentals playing out—or likely to play out—in 2026.
Firstly, let’s talk about AI—it’s now been around for about two years since ChatGPT’s adoption exploded in November 2023. There’s great promise in AI, and I certainly believe it’s as significant as the internet was in the late 1990s/early 2000s. Some of you reading this will be too young to remember, and some not even born… Sorry! But here’s a history lesson.
The rapid adoption of the internet in the late 1990s sparked unprecedented hype, leading to a surge in overvalued companies that promised revolutionary changes but often lacked sustainable business models, culminating in the dot-com bubble burst of 2000-2002. Firms like Cisco Systems saw its market cap balloon to over $500 billion at its peak in March 2000, only to plummet 90% by late 2002. Similarly, Sun Microsystems reached $200 billion before collapsing.
Today’s AI adoption mirrors this pattern in some ways, with explosive growth driving similar overvaluations—though underpinned by more tangible innovations. Nvidia, the chipmaker at the heart of AI, has seen its market cap soar to ~$4.5T by December 2025, with ~$72B in profit (albeit at ~46x earnings)—echoing Cisco’s infrastructure boom but at a grander scale. OpenAI has raised ~$40B in its latest round at a $300B valuation, while projecting revenues of just ~$125B by 2029.
Let’s dig deeper into Nvidia, OpenAI, and the Hyperscalers (Microsoft, Meta, Google, Amazon).
Nvidia’s Vulnerabilities: It won’t remain the sole provider of high-end AI chips forever. As AI scales, rivals like AMD, Intel, and hyperscalers’ custom ASICs are closing gaps, potentially grabbing 20-40% market share by 2027-2028. Add antitrust scrutiny and a forward P/E of ~45-50x, and there’s little room for error.
OpenAI’s Cash Burn: The poster child of the AI boom is a prime example of detachment from reality. How the hell is it going to generate returns anywhere near its capital deployed? With ~$40B raised recently (and talks of more), it’s forecasting ~$16B losses in 2026 alone, with cumulative burn exceeding $140B through 2029. Even with optimistic revenue hitting $125B by 2029, profitability looks like a mirage—echoing dot-com darlings.
Hyperscalers’ Spending Spree:
They’ve ramped up AI infrastructure investments to ~$440B in 2025, projected above $600B in 2026—a 36% jump. This has dented free cash flow, forcing debt issuance. It’s aggressive, but if monetization lags, it could amplify a correction.
Musical Chairs All Over Again:
Think of the AI boom like a game of musical chairs—everyone’s rushing around, money flowing, feels unstoppable… until the music stops. Nvidia’s “investment” in OpenAI is circular: Money flows back as chip buys. This echoes Cisco’s loans in the dot-com era, which led to $2B+ write-offs and a 90% crash. History doesn’t repeat, but it rhymes.
Macro Outlook: Running Hot, But Watch the Risks
Let’s move to the macro economy, particularly the US. There’s a clear strategy from the Trump Administration to “run it hot”—meaning lower interest rates, which they desperately need with a debt burden now topping $38T. They’ve shifted funding to short-end maturities (sub-2 years), hinting at cuts. The risk (low, in my view) is this re-accelerates inflation. Couple it with growing fiscal deficits (remember Elon Musk’s short-lived DOGE role?), and it could play out in the US Bond Curve. I watch the 10-year yield every day—any move toward 5% will definitely impact equity prices lower. BEWARE the Bond Vigilantes.
Talking debt, gold (up 65% in 2025) and silver (up 144%) are parabolic. If you’re thinking of buying these commodities, you’re TOO LATE. These moves tie to global money debasement—interesting that while gold rallies, Bitcoin (perceived as electronic gold) is ~19% off its highs. I remain a firm believer in Bitcoin long-term, and as I’ve mentioned in prior posts, generations below X are the buyers. I foresee a decline to ~$70,000, where it looks interesting for further consideration.
Closer to home, our economy is masked by headlines: Inflation at ~3.8%, GDP growth ~1.8-2.0% (that’s OK). The problem? Over 60% of growth is from immigration; per capita GDP is a paltry ~0.4%. Key components like food, rent, and energy have cumulatively risen 14% over three years. I just don’t see how higher-than-historical migrant intake helps with cost of living— inflation remains well above the RBA’s 2-3% band. So, suggestions of further rate cuts in H1 2026 look very unlikely.
Action Items: How My Portfolio is Positioned
While I’ve laid out a rather bearish opinion for 2026, what are the action items? Firstly, let’s talk Imricor—anyone who knows me knows I’m extremely overweight and concentrated here. It’s a conscious, well-researched choice. If you want to recap my investment thesis, read “Its Not If But When”. Interestingly, the share price today (~$1.50) is close to a year ago, but in that time, Imricor raised $70M (bulletproofing the balance sheet), got one year closer to FDA decisions (two submissions pending), NorthStar approved in Europe, world’s first Ischemic VT ablation (Nov 2025), and appointed Aldo Denti (ex-J&J senior exec). Technically, it’s built a significant volume base at $1.40 and is coiling for a spring to new highs in 2026. Despite my bearish stance post-blow-off top, I have no intention of reducing holdings—it’s event-driven with big catalysts ahead.
For my other holdings, I’ve reduced equity exposure by 40% and hold 1-year Dec 2026 S&P and Nasdaq put options. (Options are really the domain of professionals—they’re complex, and ~90% of one-way bets expire worthless.) For clients, I’ve suggested partial sell-downs of 30-50%, moving funds to cash-like products or liquid fixed income. Note: If we get a global selloff, bond yields fall as central banks rescue, so prices rise—giving more than just yield. Fixed income should be in your consideration.
So, what assets am I most interested in?
I remain invested in thematics: Energy (Nuclear and Nat Gas), Robotics (albeit 40% lighter). Very small holding in Xero (after 40% sell-off). On my watch list: AI Adopters, Healthcare (GLP Drugs). Fixed Income/Cash and credit feature prominently—check MA Funds, Barwon, and I particularly like Zagga Group for single-asset residential first mortgages with yields 8-9% over 6-18 months.
Wrapping Up: Prudent Positioning for an Uncertain 2026
In summary, while the AI-driven euphoria and policy tailwinds could indeed propel the S&P 500 to one final hurrah in early 2026—pushing us into true blow-off top territory—the weight of history, extreme valuations, and legendary investors’ caution all point to a meaningful reversal ahead. Markets rarely ring a bell at the top, but the signals are flashing brightly. My portfolio reflects this view: significantly de-risked in broad equities, protected with long-dated puts, overweight in a high-conviction event-driven name like Imricor, and tilted toward cash, fixed income, and selective thematics that can withstand turbulence.
Whatever 2026 brings—whether a gentle rotation or a sharper correction—discipline and diversification remain the trader’s best edge. Stay vigilant, manage risk ruthlessly, and remember protecting capital is how you survive long enough to compound it. Here’s to a prosperous (and prudent) year ahead.