There is a familiar saying in financial markets: Sell in May and Go Away come back on StLedger Day. This saying stems from the belief markets will be quieter or somewhat benign as the northern hemisphere head into summer and fund managers and traders take time off and enjoy the pastimes of the warmer weather. There are statistics that support this theory; on average, global indices have underperformed in the May-October period compared to November-April by about 5% when measured back to 1945.
So do you act on this theory every year….. Well, of course not; it’s just a consideration, and like anything in markets, you need to weigh up all the inputs to consider your next action. It should be no surprise to you that for more than a year, I have been saying to stay out of investment markets and paraphrasing “it’s time to go fishing,” and wondering if we are heading for a “Minsky moment’. My base case has been that the fastest increase in interest rates in 50 years will eventually flow through to the economy, and we will see a significant cooling or even a recession. From that, company earnings weakness and the overall asset price decline of everything.
So far, I have been wrong!
However, good investment analysis and my 30-plus years of experience have taught me that being wrong is a natural part of investing. The key is how you manage your portfolio to limit the pain of being wrong. As you may have heard me say (now on the podcast) and write here, there is only one thing you can manage, and that is ‘your risk’’
So while this last year I have been wrong, it hasn’t cost us any money or we haven’t had any realised losses. We haven’t gone short markets, but rather we moved to an overweight cash position in our portfolio and have had modest cash returns. Well, maybe you could argue that by being in cash vs. invested, we have lost on opportunity cost. Thanks, but I’ll take the lost opportunity every time ahead of real losses.
As I write this post, the fundamentals for the economy don’t seem to look any better than they did a year ago, six months ago, or even last month.
We have seen more small bank defaults in the US, an overhyped expectation that China’s re-opening was to be the saviour for global growth (it’s been grossly underwhelming), interest rates remaining on a tightening bias, commercial real estate in real trouble, and credit contraction or deleveraging across the globe acting as a further brake on growth. Add the debate on US Goverment Debt ceiling limits and none of these suggestions, and we are about to enter the next long-term bull market.
So why are equity markets squeezing higher? Most markets are up 7–10% in the last 6 months. It’s all about liquidity and market positioning. I’ve written about liquidity in my previous post, “Liquidity trumps Fundamentals.”
Liquidity is fading, and unless we get a rapid about-turn in interest rates, this dynamic won’t continue to push markets higher.
First, the VIX Index, which is the volatility index, measures the expected volatility of the S&P 500 over the next 30 days, which reflects the market’s risk sentiment. The VIX is often called the fear index, and on June 22 and October 22 the VIX was trading at 1-year highs at 35 (all-time highs exceed 85) against the current price of 18. To give some context, the long-term mean of the VIX is 15.
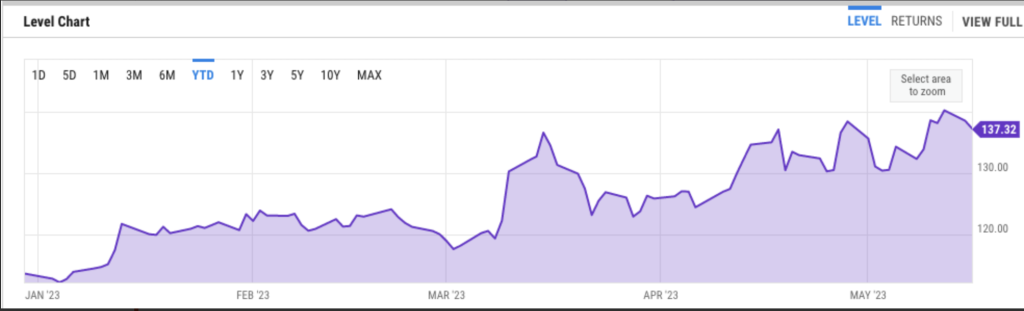
So, the VIX is telling us we are entering a benign period, and it’s the slow grind higher on equities that have led to the retreat of the VIX despite bank collapses. I am interpreting this as a sign of complacency and a nice setup for a reversal. The 2nd measure is the put-call ratio. The put-call ratio measures market sentiment or positioning. A number less than 1.0 represents more calls or bullish positioning, and a number above represents more puts or bearish sentiment. The current ratio is 1.37, which shows us that professional or sophisticated investors are positioned for a market correction. At current levels, it is at its highest in the last year.
However, just looking at the put-call ratio can be misleading as it always has a bias to the downside—managers are likely to have some hedging against their underlying portfolios at any given time. So, you actually need to review the put-call ratio skew. (I hope I haven’t lost you here), but it measures the difference in implied volatility between the two options. Equally, one put and one call of the same value.
Well, when you look at the skew, it shows a 20% increase in bearish stance in the last 6 months and herein lies … why equity markets are bid. Markets do not like going where everyone expects them to go.. and so until we see some real data destruction, equities are likely to remain elevated. With the backdrop of a slowing economy, I remain of the view that we just sit this out.
Put Call Ratio Chart
But sitting out doesn’t mean doing nothing. In my last post, “Minsky Moment” I advocated that this is a very good time to look at genuinely allocating to fixed-income style assets. I gave a reasonable breakdown of the asset allocation in that post. You can see it again here: “Minsky Moment” This month I want to have a look at real estate and in particular commercial and industrial, although I have a view on long-term residential returns.
As a licensed financial advisor, I am inundated with fund managers and broking houses trying to persuade me to invest my clients’ funds with them. I’m very selective, and I don’t allocate for a client that I haven’t allocated for myself. But these fund managers are very helpful and do bring ideas and products to us. I asked one of the preferred fund managers, MA Funds, which specialises in property, to run a valuation matrix on all ASX-listed property REITs.
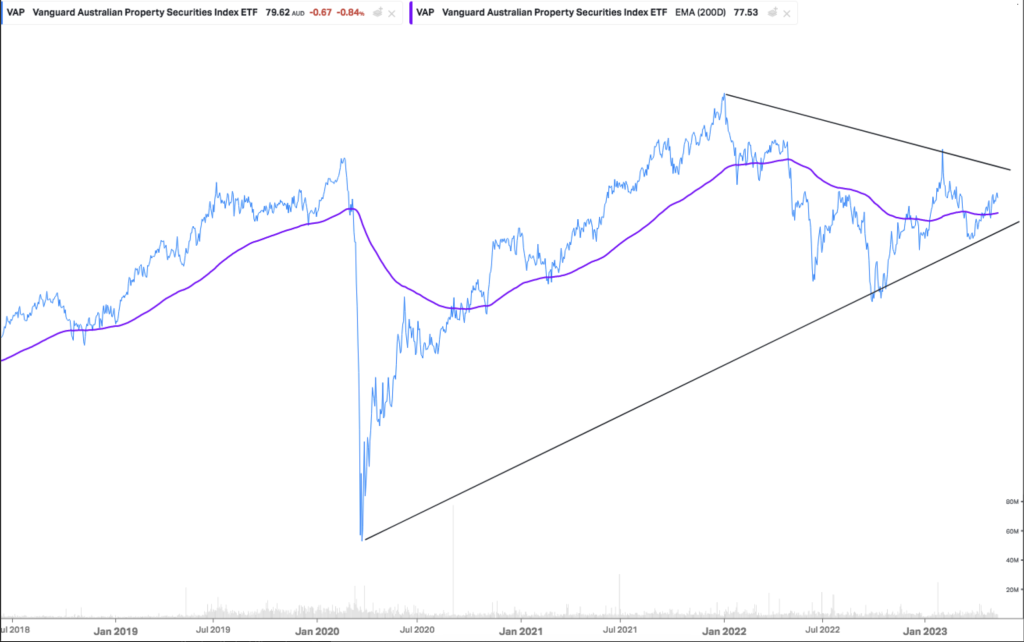
I wanted to look at if any opportunities were presenting themselves, as this sector has been understandably underperformed. On average, the Property Index is down 20% from its high but was down as much as 35% on Oct 22. However, this index disguises some much larger declines in the sector breakdown. The commercial property is at an average of 35% from its peak on June 21. The obvious catalyst is COVID and working from home. I can’t bring myself to allocate to commercial property, as I still see some significant issues. We are yet to see any material recent sale that will reset the latest valuations, and with that, we will see who has been swimming naked, as some REITs will see their equity get decimated.
Further, there is evidence of the releases coming in significantly below priors.. so let’s skip commercial real estate at this point for any allocation.. That will change, as it is not as if these properties are worth nothing, but there is a saying that markets don’t catch a falling knife. Having said that, I am seeing some value in the industrial property sector; average yields are paying 6.0%, and the average discount to net asset value is 25%. This is looking attractive, but there is a strategy within a strategy, and any allocation there will only be 30% of what my ultimate allocation would be. I also see a descending wedge in this sector, so I prefer an allocation toward the bottom of the trendline. For those clients with an account with us, we will be emailing separately our advice on this strategy.
Moving onto residential real estate, I read a very interesting piece from a property fund manager (link here if interested, Milford Asset Mgmt) that suggests the structural deflation from the ’80s until 2022, which led to an ever-decreasing interest rate environment and the asset price boom of residential property, is over. That significant asset boom is a direct consequence of low-interest rates. I have said many times in my post that the low-interest environment is over, and we won’t see 2.0% mortgage rates anytime in the next decade.
Historically, or at least in the last 50 years, the baby boomers and Gen X have seen property prices double every 10 years. In my view, this is now history and is unlikely to continue. Here is why, I expect mortgage rates to range from 3.5% to 6.5%, and we are approaching the top of that cycle now… but with wage growth of circa 3.0%, I expect property prices to track similarly, maybe 5.0% at best, with an influx of migrants. So your 10 years become 14 years. Of course, this is an average Australia-wide, and of course, there will be geographic pockets of growth that outperform.
But if you look at the numbers on investing in residential property, it’s hardly compelling. The average rent yield is 2.87% the average investment property mortgage rate is 6.0%. The loss here is circa 3.0% per annum. OK, then claim the negative gearing. We bring that down to a net loss of 1.5%. Deduct this from your growth yield of 5.0%, and your real return is now 3.5%, and then this would take 20 years to double. It’s a change of mindset I am asking you to consider around residential property investment.
My rule of thumb on asset allocation is your principle you hold makes you neutral. If you add an investment property, your long, and if you don’t have any property, you are short. I have never and would never advise anyone to be short property.
To close, always add a little to Crypto markets. I remain invested in Bitcoin and Ethereum and have exposure to decentralised finance through a professional manager at Apollo Capital. I remain a believer in this asset class, but noting it only represents 5% of my total portfolio. I can see a scenario where the BTC USD price, currently $27K USD, falls to circa $22k–$24k USD, this being the 220-day moving average with the current price.
This past month or so, I have really started to explore the use of AI with Chat GPT. With my business partner, Anthony Lyon (head of wealth management), we are pioneering and trialing this technology for business process improvement. I have some strong early views on what this technology will do in the coming years, but let’s save that for next month.
So as we enter winter and the northern hemisphere enters summer, we continue to stay the course of limited or low allocation of risk on any assets. Boring!!! I know!